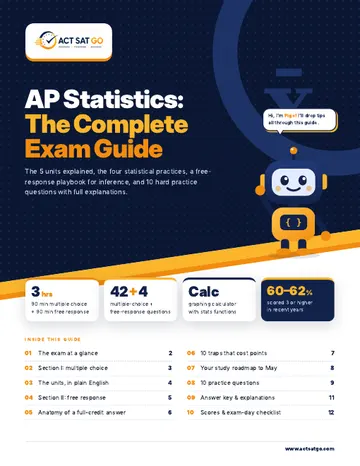
The exam at a glance
| Section | Weight | Timing | What you do |
|---|---|---|---|
| I · Multiple choice | 50% | 1 hr 30 min · 42 questions | Questions across all 5 units, testing the 4 statistical practices. Many use data displays, study descriptions or computer output. Calculator permitted. |
| II · Free response | 50% | 1 hr 30 min · 4 questions | Q1 formulating questions and collecting data; Q2 analyzing data and interpreting results; Q3 inference; Q4 a multi-content question that combines ideas. Calculator permitted. |
Everything happens in Bluebook
You answer every question, including the written responses, in College Board's Bluebook app, which has a built-in Desmos graphing calculator. Practice typing timed answers before May.
Formulas and tables are provided
A formula sheet and statistical tables (normal, t, chi-square) are available. Knowing when to use each formula matters more than memorizing it.
The multiple-choice section
42 questions in 90 minutes gives you a little over 2 minutes per question. Many questions are about interpreting studies and output, not heavy calculation. Wrong answers lose no points.
Strategies that work
- Identify the procedure first: one or two samples? Proportions or means? Test or interval?
- Watch the wording of interpretations. "95% confident" describes the method, not a 95% chance for this interval.
- Sketch the normal curve and shade before computing any probability.
- Read computer output carefully: slope, intercept, s, r and r², and what each means in context.
- Eliminate absolute words like "proves" and "always" in study-design questions.
- Flag and move on after 3 minutes. Return once the quick points are banked.
The 5 units, in plain English
Exploring One-Variable Data & Collecting Data
Describing distributions and designing good studies.
Be ready to: Describe shape, center, spread and unusual features in context; use z-scores and the normal model; identify sampling methods and bias; design experiments with random assignment, control and blocking.
Probability, Random Variables & Distributions
Chance, simulation and the distributions that model it.
Be ready to: Use probability rules and two-way tables; test independence; run simulations; find the mean and SD of discrete random variables; use binomial models; describe sampling distributions.
Inference for Categorical Data: Proportions
Intervals and tests for proportions, plus chi-square.
Be ready to: Check conditions; build and interpret confidence intervals; carry out significance tests for one and two proportions; interpret p-values, Type I and II errors and power.
Inference for Quantitative Data: Means
Intervals and tests for means using t-procedures.
Be ready to: Choose between one-sample, paired and two-sample t-procedures; check conditions; build intervals and run tests; interpret results in context.
Regression Analysis
Relationships between two quantitative variables.
Be ready to: Describe scatterplots; interpret slope, intercept, r and r²; use residuals and residual plots; identify influential points; make predictions and avoid extrapolation.
Unit 1, describing data and designing studies, is the biggest unit and underpins everything else; inference (Units 3–4) together is a similar share. Every question tests one of the four statistical practices: formulate questions, collect data, analyze data and interpret results.
The 4 free-response questions
90 minutes, 4 questions, with credit for each part, so complete, clear communication matters.
Questions and collecting data
Pose an investigative question, then plan a sample or experiment and explain how it avoids bias.
Name the treatments, random assignment and response variable explicitly.
Analyzing and interpreting
Describe distributions or relationships, compute probabilities or statistics, and interpret them in context.
Compare center, spread, shape and outliers using comparative words.
Inference
Carry out a test or interval: state hypotheses and parameter, name the procedure, check conditions, calculate, and conclude in context.
Link the p-value to α and to the claim in one sentence.
Multi-content
Pulls together several units in an unfamiliar setting. Rewards careful reasoning more than recall.
Read the whole question before starting; later parts often hint at earlier ones.
Time plan: About 20 minutes for Q1, 22 for Q2 and 24 each for Q3 and Q4. Every answer needs context: "the mean is 12" scores less than "the mean wait time is 12 minutes".
Habits that earn points
- Define every parameter and variable in context.
- Check conditions with numbers, not just names.
- Show formulas, not only calculator results.
- Never say a test "proves" or "accepts" H₀.
- Stuck? Name the procedure; that alone can earn credit.
10 traps that cost points
No context
Every description and conclusion must mention the variable and the population in the problem.
Wrong confidence interval interpretation
"We are 95% confident the interval captures the true proportion," not "95% of students…" or "95% chance".
"Accepting" the null
You fail to reject H₀. A large p-value is not evidence that H₀ is true.
Causation from observation
Only randomized experiments support cause-and-effect conclusions.
Conditions without numbers
"Large counts" needs np̂ ≥ 10 and n(1 − p̂) ≥ 10 shown with values.
Paired vs two-sample
Before-and-after on the same subjects is paired. Use the differences.
Practical significance
A tiny p-value means a result is unlikely to be chance alone, not that the effect is large or important.
Residual sign
Residual = actual − predicted. A negative residual means the model overestimated.
Bias vs variability
A bigger sample reduces variability, not bias from a flawed sampling method.
Calculator-speak
"normalcdf(…)" alone may not earn credit. Name the distribution, parameters and boundary.
A study roadmap to May
A steady plan beats a last-minute rush. Shift the months to match your teacher's pacing.
- Sep – Oct
Unit 1: describing data and study design
Distributions, the normal model, sampling and experiments. Write one "describe and compare" paragraph each week.
- Nov – Dec
Unit 2: probability and random variables
Probability rules, simulation, random variables, binomial models and sampling distributions.
- Jan – Mar
Units 3–4: inference
Intervals and tests, Type I and II errors, power and chi-square. One full inference question every week.
- April
Unit 5 + timed sections
Regression and residual analysis, then full timed multiple-choice and free-response sets.
- Early May
Communication polish
Rewrite weak answers using rubric language. Review the traps list.
- May 2027
Exam day
Tuesday, May 11, 2027 (afternoon session). Sleep well and confirm your start time with your AP coordinator.
3 practice questions
Original questions written by ACT SAT GO in the style of the exam. The free PDF has 10, with full explanations.
- Unit 3 · Confidence intervals
A 95% confidence interval for a population proportion is (0.42, 0.50). Which statement is correct?
- A If we repeated the sampling many times, about 95% of intervals made this way would capture p
- B There is a 95% probability that p is between 0.42 and 0.50
- C 95% of sample proportions fall between 0.42 and 0.50
- D p is definitely between 0.42 and 0.50
Show answer
Answer: A. "95% confident" describes the method: about 95% of intervals built this way capture the true proportion. Any single interval either contains p or it does not.
- Unit 5 · Residuals
The least-squares line is ŷ = 12 + 3.5x. For x = 8, the observed value is 38. What is the residual, and what does it mean?
- A −2; the line overestimates
- B 2; the line underestimates
- C −2; the line underestimates
- D 40; the predicted value
Show answer
Answer: A. The predicted value is 12 + 3.5(8) = 40. Residual = actual − predicted = 38 − 40 = −2, so the line overestimates.
- Unit 4 · Choosing a procedure
Each of 15 students takes a pretest and a posttest. Which procedure estimates the mean improvement?
- A Two-sample t-interval for μ₁ − μ₂
- B Two-proportion z-interval
- C Chi-square test for independence
- D Paired t-interval for the mean difference
Show answer
Answer: D. The same students are measured twice, so the data are paired. Work with each student's difference and use a paired t-interval.
How students score
Ranges reflect recent College Board score distributions and shift a little each year. Credit and placement policies vary by college.
Aiming for a 5 in AP Statistics?
Book a free diagnostic session. We'll find your weakest units, review your practice responses and give you a week-by-week plan to exam day.